MBTA Rider Segmentation
Contents
- Team
- Introduction
- Project Deliverables
- Github Organization Structure
- Full Package Structure
- Installation
Team
Harvard 2018 Spring AC297r Capstone Project: Chia Chi (Michelle) Ho, Yijun Shen, Jiawen Tong, Anthony Hou
Our github: organization
Introduction
The Massachusetts Bay Transportation Authority (MBTA) is the largest public transportation agency in New England, delivering a complex system of subway, bus, commuter rail, light rail, and ferry services to riders in the dynamic economy of the Greater Boston Area. It is estimated that MBTA provides over 1.3 million trips on an average weekday. While MBTA collects a wealth of trip transaction data on a daily basis, a persistent limitation has been the organization’s lack of knowledge around rider groups and their respective ridership habits. Understanding rider segmentation in the context of pattern-of-use has significant implications in developing new policies to improve its service planning and potentially changing its fare structure.
Project Deliverables
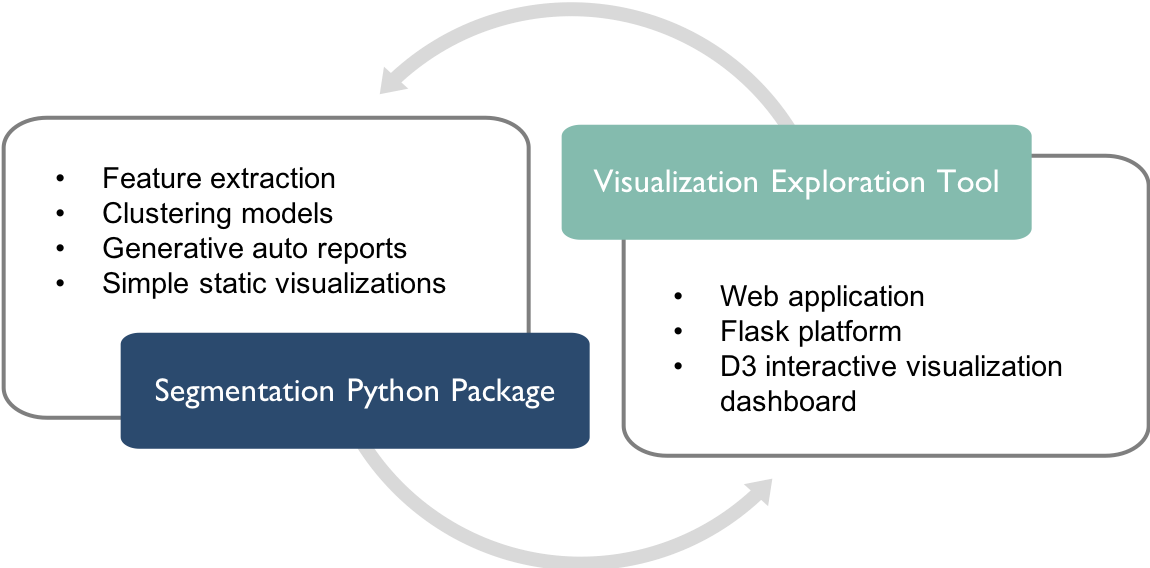
This repo contains code documentation for both of our deliverables:
- Python Rider Segmentation Package
- Web-based Visualization Exploration Tool
 |
|---|
| Figure 1: Project Deliverables |
Github Organization Structure
- Rider-Segmentation-Full-App: This is the code base for both the Python segmentation package and the app with full functionality (i.e. based on user input, the app is able to send clustering request to the Flask backend on a new data set or user-specified weights/duration that has not been cached. Disclaimer: The full input source is not available on Github for security reasons, and each new clustering request takes at least several hours.)
- Dashboard: This is the static version of the full app that has limited functionality (The app is only able to display pre-ran monthly clustering results for Dec 2016 to Nov 2017 with equal weighting on temporal, geographical and ticket purchasing pattern.) The app is deployed as a Github page (https://ac297r-mbta-2018.github.io/Dashboard/).
- Final-Report: This repository hosts the final report which is deployed as a Github page (https://ac297r-mbta-2018.github.io/Final-Report/).
- Code-Documentation: This repository hosts the content of this code documentation which is deployed as a Github page, current page.
Note: The limited Dashboard, Final Report and Code Documentation are linked via a navigation bar on respective Github pages.
Full Package Structure
The high-level functionality of this rider segmentation package is to group individual MBTA riders according to pattern-of-use dimensions. Our full package has the following structure:
Rider-Segmentation-Full-App/
    MBTAdashboard/
        __init__.py
        app.py
        src/
            __init__.py
            json_generator_driver.py
            utils.py
        static/
            css/
                'custom css files for D3 visualization'
            img/
                'MBTA icon images'
            js/
                'custom javascript files for D3 visualization'
            lib/
                'javascript, css, and fonts library files'
        templates/
                'html files'
    MBTAriderSegmentation/
        __init__.py
        config.py
        features.py
        profile.py
        report.py
        segmentation.py
        visualization.py
        []_driver.py
        Manully_Label_Clusters.ipynb
        Train_Report_Model.ipynb
        data/
            cached_clusters/
                'cached clustering results' - not published
            cached_features/
                'cached extracted rider-level pattern-of-use features' - not published
            cached_profiles/
                'cached cluster profiles'
            cached_viz/
                'cached cluster geographical distribution visualization from the visualization module'
            input/
                census/
                    'census data'
                geojson/
                    'data to draw the maps'
                afc_odx/
                    'AFC/ODX data' - not published
                fareprod/
                    'Fare product data' - not published
                stops/
                    'MBTA Stops data' - not published
            report_models/
                report_cnn.h5
A brief item description for MBTAdashboard:
app.pymodule handles the communications between the front-end dashboard and the back-end Python codes. This is based on the Flask platform.srcdirectory contains autils.pywhich is the back-end engine of the dashboard and ajson_generator_driver.pywhich generates static json files for use in the limited Github version of the dashboard.staticdirectory contains static css, javascript and image files for the dashboard.templatesdirectory contains html files to render the dashboard.
A brief item description for MBTAriderSegmentation:
-
config.pymodule sets global constants (e.g., data path, file prefix, rider type dictionary) that are used in the other modules. -
features.pymodule extracts different sets of rider-level features (details) from transaction-level data and save the extracted features in thedata/cached_features/directory. -
segmentation.pymodule handles the actual rider segmentation procedure and saves the rider features with its cluster assignment in thedata/cached_clusters/directory. -
profile.pymodule profiles the clusters by summarizing cluster pattern-of-use features, inferring cluster demographics distributions as well as callingreport.pymodule to produce a short descriptive text for each cluster. The cluster profiles are saved in thedata/cached_profiles/directory. -
report.pymodule handles automatic report generation. It is called byprofile.py, and its results are appended as a an additional column to the cluster profiles data frame that is eventually saved in thedata/cached_profiles/directory. -
visualization.pymodule contains functions to generate various static visualizations to explore the clusters in python. -
[]_driver.pyfiles contain sample usage code for the indicated module (e.g. features_driver.py is sample code foe the features.py module). The only module without a driver.py isreport.pybecause it is not directly used by users. -
Manully_Label_Clusters.ipynbnotebook contains starter code to manually label clusters to train the auto report generator. -
Train_Report_Model.ipynbnotebook contains starter code to train the auto report generator. -
datadirectory contains the input data files from MBTA and external data sources (i.e., US census, MA geojson, MBTA geojson, MBTA AFC/ODX, MBTA fare product, MBTA stops) and output files from various modules in this package (i.e. extracted feature incached_features, segmentation results incached_clusters, profiled cluster summaries incached_profiles, cached cluster geographical distribution visualizations incached_viz, and a trained CNN model to classify temporal patterns inreport_models).Note: the segmentation module creates subdirectories in the
cached_clustersdirectory when saving the result. Based on the choice of pipeline, the results are saved inhierarchical/resultsornon-hierarchical/resultssubdirectories. For reference, the segmentation module also saves the clustering Calinski-Harabaz scores of each algorithm (LDA and K-means) inhierarchical/scoresornon-hierarchical/scoressubdirectories. The profile module also creates subdirectories in thecached_profilesdirectory when saving the result. The name of the subdirectory it creates is based on the starting month and duration. For instance, for a start month = ‘1701’ and a duration = 1, the resulting subdirectory is ‘2017-Jan’; for the same start month and a duration = 2, the resulting subdirectory is ‘2017-Jan_to_2017-Feb’.
Installation
- Step 1: Download code from our github
git clone https://github.com/AC297r-MBTA-2018/Rider-Segmentation-Full-App.git - Step 2: Obtain AFC, ODX, stops and fare product data from MBTA
Note: We did not publish this data for security reasons.
- Step 3a: Run modules from MBTAriderSegmentation
cd Rider-Segmentation-Full-App/ python3 MBTAriderSegmentation/[]_driver.py - Step 3b: Run dashboard
cd Rider-Segmentation-Full-App/
python3 MBTAdashboard/app.py
Copy and paste the local host link (http://0.0.0.0:5000/) in a browser to view the dashboard